Getting Started
Step 1
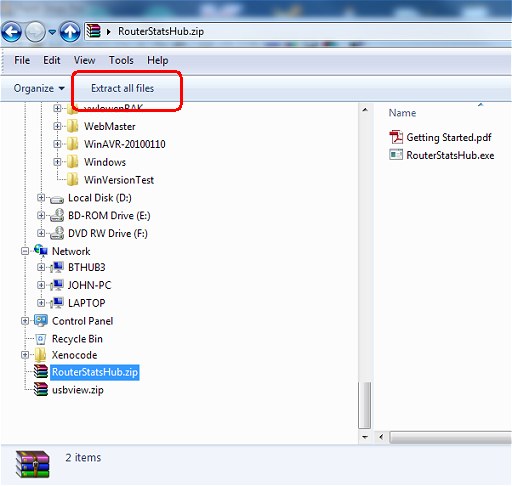
Download routerstatsHub.zip or routerstatsHub5A.zip (as appropriate for your Home Hub) to your Desktop.Using Windows Explorer, navigate to where you downloaded the zip file and click on it. Then click Extract all files at the top of Windows Explorer:
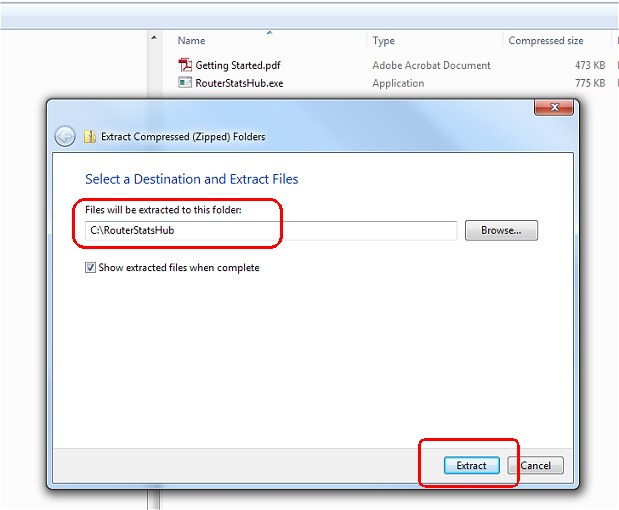
Type or navigate to a suitable folder to which to extract RouterStatsHub and click Extract:
If you're running any Windows version newer than XP, RouterStatsHub will only run in its own folder as shown below. (For example: C:\RouterStatsHub\RouterStatsHub.exe)
Once extracted, right-click on your Desktop and select New -> Shortcut. Navigate to the folder in which you extracted RouterStatsHub.zip and create a desktop shortcut to RouterStatsHub.exe
Step 2
Double-click the desktop icon to open RouterStatsHub.
The first time RouterStatsHub is run, it will automatically open the Setup Wizard shown below:
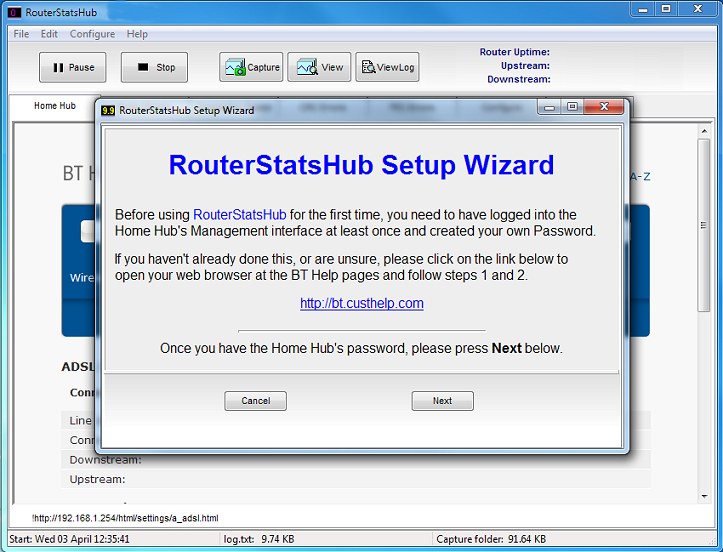
Before RouterStatsHub is able to access the Home Hub's management interface, you need to have logged into the Home Hub with your web browser at least once in order to set a new password.
Full instructions are provided on BT's Help pages at BT Customer Help (link opens in a new tab). Once you know the password you use to access your Hub, click the Next button on the RouterStatsHub setup wizard:
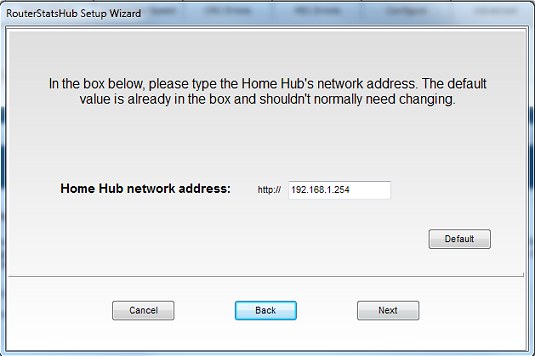
Type your network address in the box. This is usually 192.168.1.254 unless you have already changed it on your network. Leave it at the default value if you're unsure.
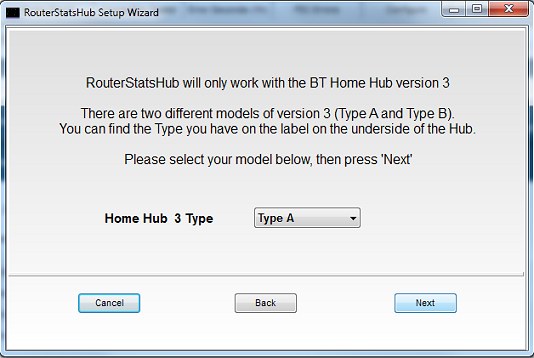
On the next wizard page, select the type of Home Hub you're using. The two types are very different and RouterStatsHub will not work unless the correct Type is selected.
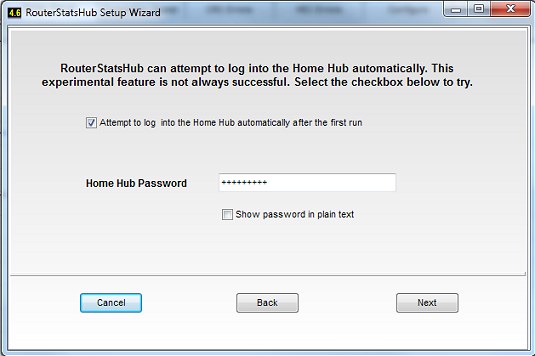
If you have a Home Hub 3 Type A, RouterStatsHub will attempt to log into the Home Hub automatically if you select the Attempt to log into the Home Hub automatically after the first run checkbox. You will need to log in manually the first time, though, because RouterStatsHub needs to be taught how to find the page with the Connection Information.
Type your password into the box and press the Next button.
Unfortunately, I haven't been able to get a Type B to log in automatically so you will not be shown this page of the setup wizard.
On the last page of the wizard, there is nothing to type so just press Finish.
Home Hub Type A
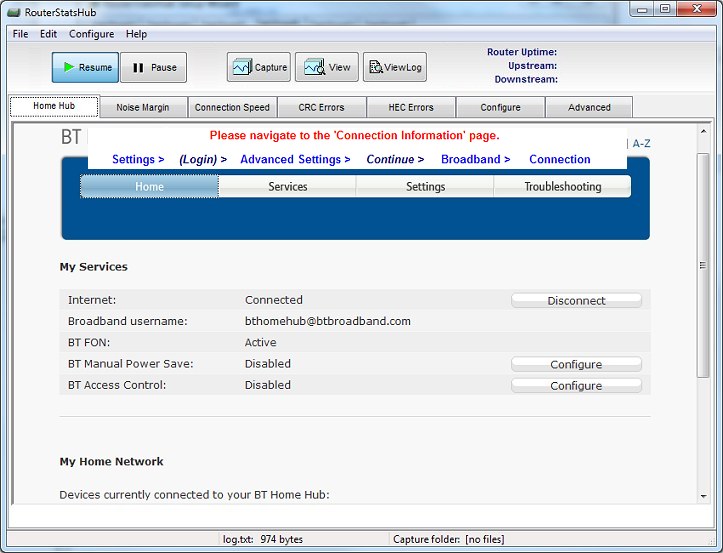
RouterStatsHub will open on its Home Hub Tab displaying the Home Hubs 'Home' page. Because I've found that the page to the Connection Information can vary (believe it or not!), it's necessary for you to navigate to the Connection Information page "manually" on this first run. You will only be asked to do it the first time RouterStatsHub runs - unless the Home Hub decides to move the page!
To navigate to the Connection Information page, press Settings, at which point the Home Hub will ask you to log in. After logging in, click Advanced Settings and then press the Continue to Advanced Settings button. Then click Broadband, followed by Connection. (RouterStatsHub shows the "trail" you need to follow at the top of each page.)
You should now be looking at the ADSL Line Status / Connection Information page. Best of all, RouterStatsHub now knows where the page is as well so you need only do this once!
Home Hub Type B
When you close the setup wizard, you should be looking at the Home Hub's Login page. Once logged in with the Home Hub password, RouterStatsHub will take you directly to the Connection Information page. Unfortunately, with the Type B Home Hub, you will need to log in manually each time you Open RouterStatsHub.
First Run
At this stage, RouterStatsHub should have automatically started collecting data samples from the Home Hub. Click the Noise Margin Tab (just below the Pause button), wait a few minutes for RouterStatsHub to begin collecting the data and the values should begin to appear on the graph.
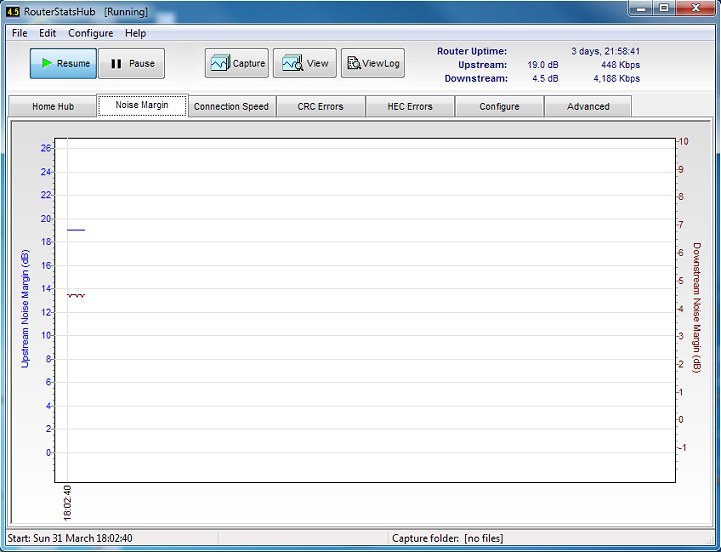
The plots on the graphs will take a few minutes to appear but the current downstream Noise Margin
will be shown on the system icon on the left end of the
Each graph shows the upstream value on the left vertical axis (plotted in
blue) and the downstream value on the
right vertical axis (plotted in maroon).
Other graphs plot upstream and downstream values for Connection Speed, CRC Errors and
HEC Errors. The last two
graphs can be configured to show different values instead.
See User defined graphs.